
We often discuss on this site inflation and its effects on a macro or world level. But inflation is a personal item because you and I go to the grocery store, buy gas, go to the doctor, and feel the overall effect of inflation every day. Inflation is like a hidden tax that gnaws away at your savings and paycheck. Like taxes, inflation often originates with Congress or nearby government functions like the Federal Reserve. And like so many other bouts with inflation, this time it originated with Congress, and then the FED attempts to tame it have only made things slightly better in the short term and disastrous in the long term.
Avoiding Banana Republic Status
Few people know that we printed a $100,000 gold certificate in our history. The bills did not circulate and were used to settle large bank transactions. This was long before the days of electronics and settlement took place physically. The bill featured Woodrow Wilson and was backed by gold. Other large denomination bills circulated, and consumers could have denominations as large as $10,000. Today, we limit the largest denomination circulating bill to $100, primarily to make drug settlements and illegal transactions challenging to do in cash, but apparently, this is not a deterrent.

While doing this article, I wondered what the old Woodrow Wilson $100,000 gold certificate would be worth today. While not a perfect measure, the price of gold in 1934, when the last bills were printed, is our starting point. FDR did a little trick with his gold confiscation. In 1932, the exchange rate for an ounce of gold was fixed at $20.34 per dollar. The Gold Reserve Act of 1934 changed that rate to $34.69 per ounce, a 42% instant devaluation overnight. For this analysis, I want to use the 1932 benchmark rate of $20.34 first because it represents the dollar value of gold before FDR’s spending spree.
In 1932, $100,000 would purchase 4,916 ounces of gold. By 1934, that had declined to 2,882 ounces. Today, that same $100,000 will buy about 49 ounces. Some quick math will tell us what Congress and the FED have done to our economy since then.
- In 1932, 4,916 ounces of gold could be purchased for $100,000.
- In 1934, thanks to FDR, that same 4,916 ounces would cost $170,536.
- Today (11/30/2023), that 4,916 ounces would cost $10,097,464.
With gold as our long-standing measure of value, we can also work backward and realize that $1.00 in 1932 has a depreciated buying power of less than $0.01 today. There has been a 99% depreciation in the dollar’s value in less than a century thanks to FDR, subsequent Presidents, Congress, and the FED. A person worth $10,000 in 1932 would be the same as a modern-day millionaire.
A lot more happened since FDR and World War II to hasten this decline, but it started there and has been on a steady march ever since. Dropping the gold standard and then the silver standard opened the door to more spending by Congress. Our penchant for deficit spending and consumer borrowing also hastened the dollar’s decline. We all had a part to play in this destructive process.
Inflation in this Century
You can see from this chart for the Annual Inflation Rate that in the early part of the twenty-first century, we held inflation down to a range of 1.5% to 3.5%. That is a decent level to ensure some growth in the economy. But this era of prosperity led to some terrible decisions on Wall Street, and in 2008, it all fell apart. Sparked by the housing crisis and a unique instrument created just for this mess, Mortgage Backed Securities, we experienced a slight deflation, which caused the FED to panic. From that point until 2020, interest rates were manipulated to force an annual average of 2%, which is the source of many of our current problems. During the Obama and Trump Administrations, this low-interest rate policy continued, first for political reasons and then for COVID. In 2021, the dam finally broke, and the FED could no longer hold rates down. We had issued too much Federal Debt, and purchasers demanded a higher rate to keep buying. Those spikes in rates are apparent here.

Now that we have experienced all this, what has it done to our purchasing power, the thing we feel when we go to the grocery store?
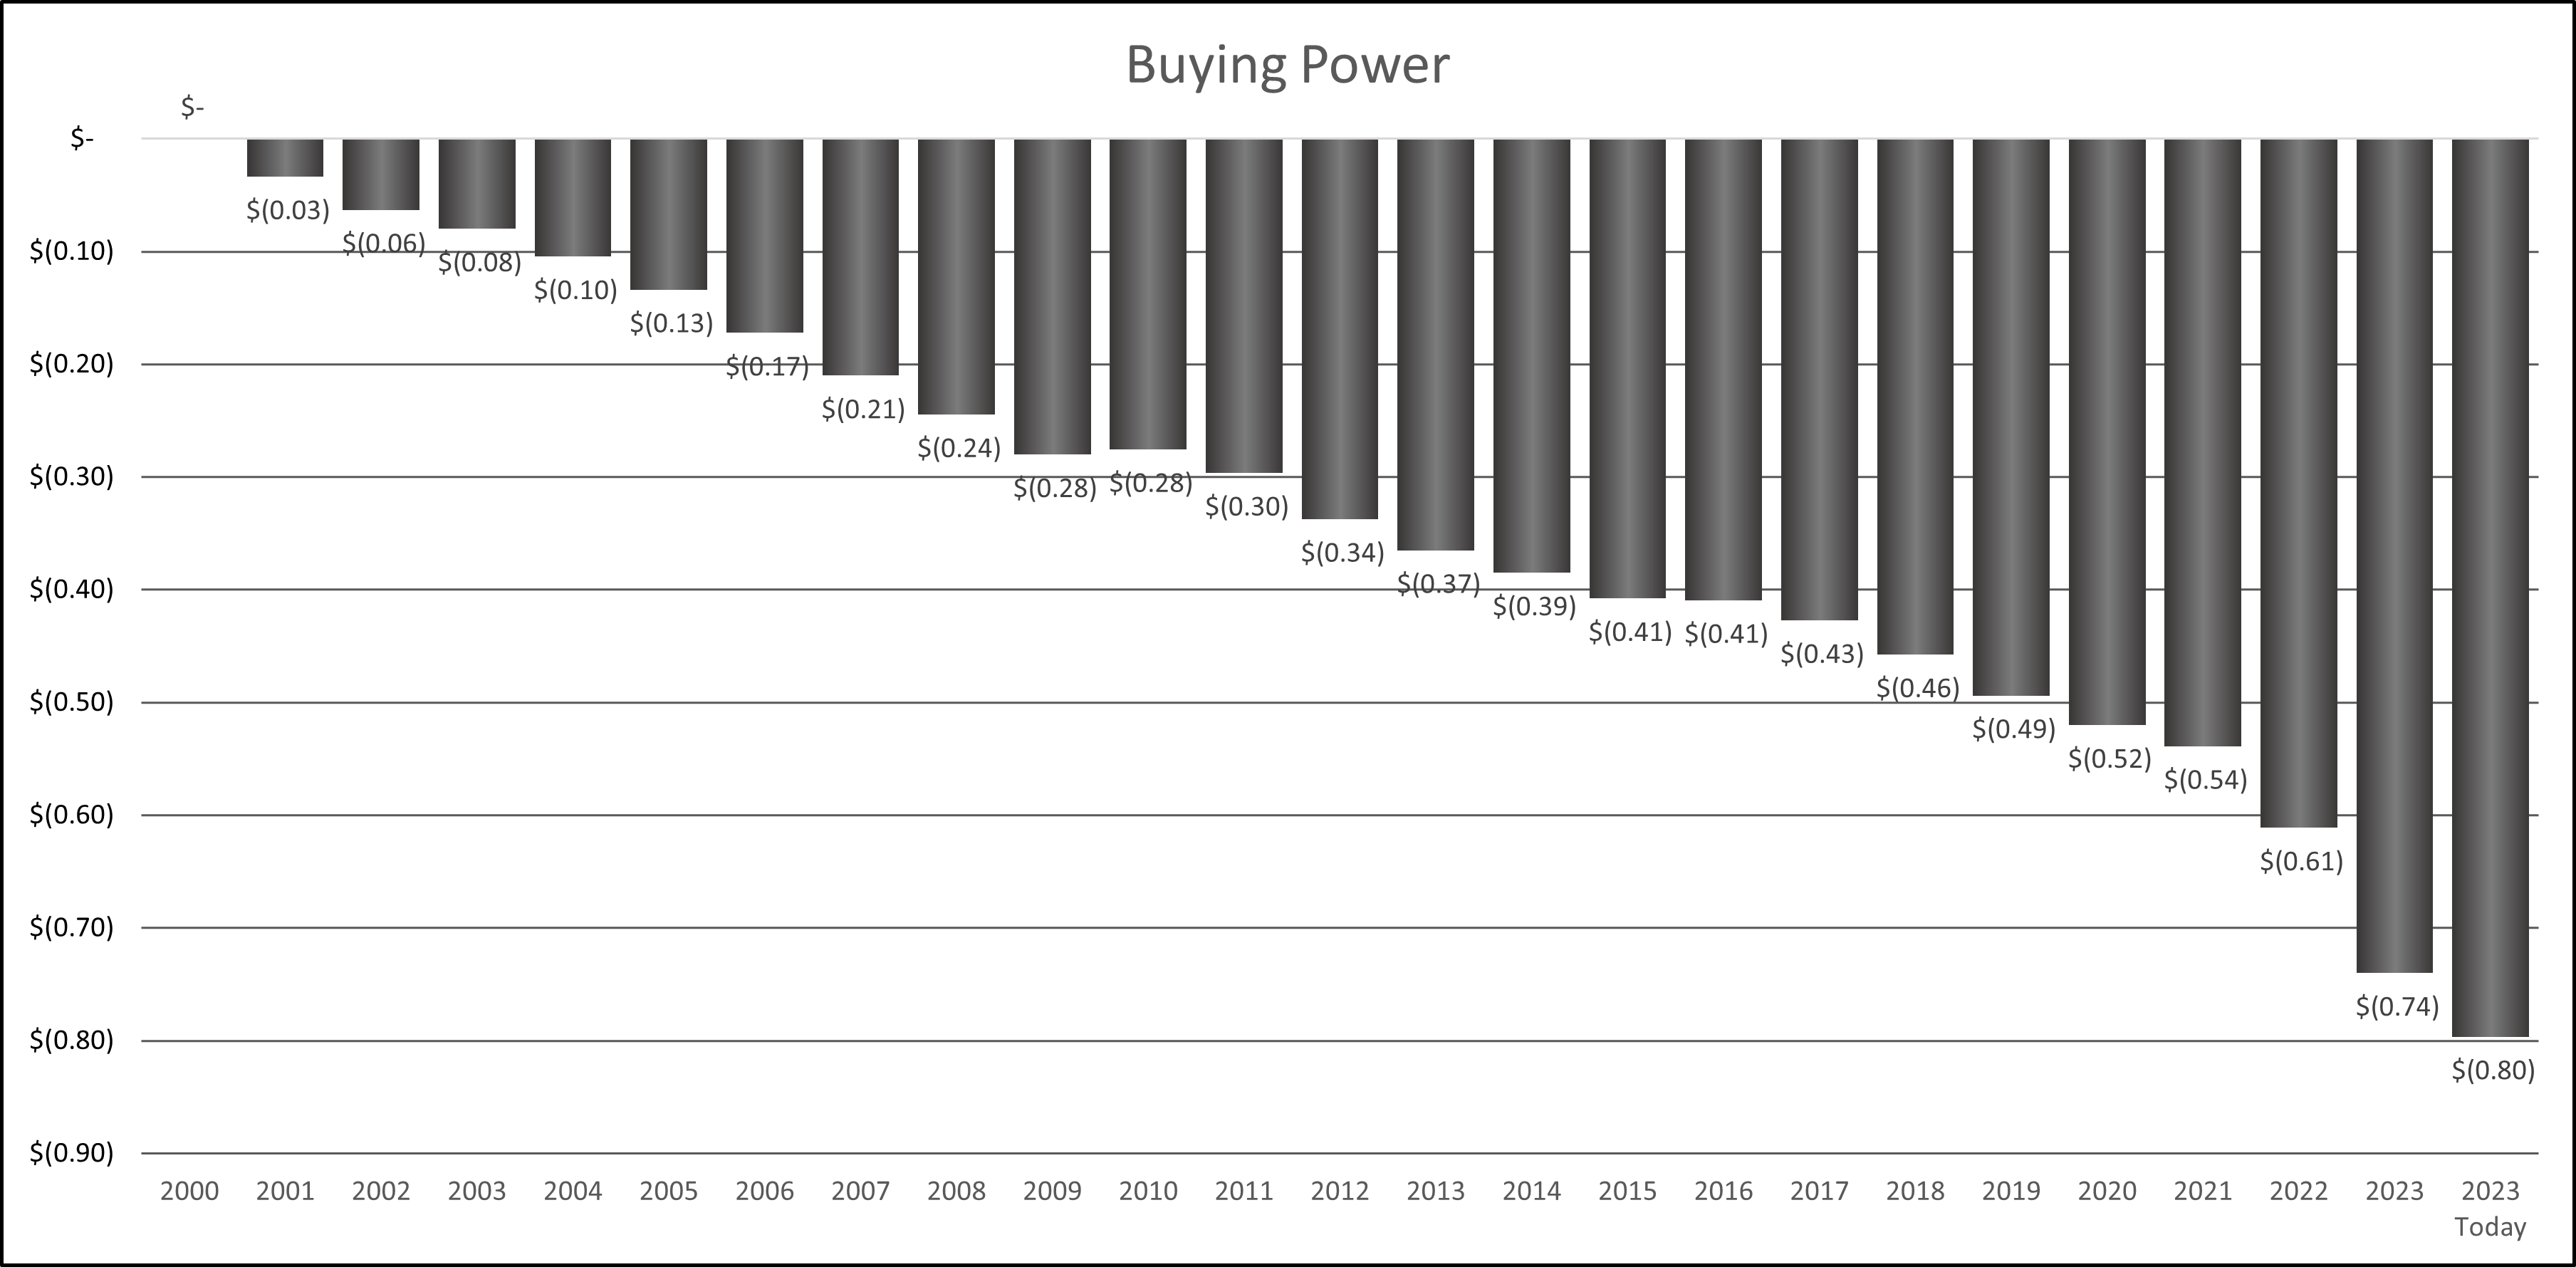
The accumulated effect shown in our Buying Power chart since 2000 is staggering. The dollar has lost 80% of its value since 2000. A person who retired in 2000 has seen 80% of their purchasing power disappear. Someone who entered the workforce in 2000 would have to make $1.80 today for every dollar they earned in 2000 to stay even. For most, this is unattainable, so people are dissatisfied with Washington and restless.
Today’s Issues and Inflation
The disconnect between the FED, Congress, and us is the practical experience of going to the gas station or grocery store instead of using charts and measuring inflation dozens of ways. They analyze inflation, but we feel inflation. When the numbers look bad, they redefine or discontinue collecting them.
Let us investigate some basic things we think about and how they are doing. I will look at only the most current issues from 2020 until 2023 to bring this closer into closer focus. The U.S. Bureau of Labor Statistics tracks prices regularly, and we will use their data for consistency.
All Inflation Items
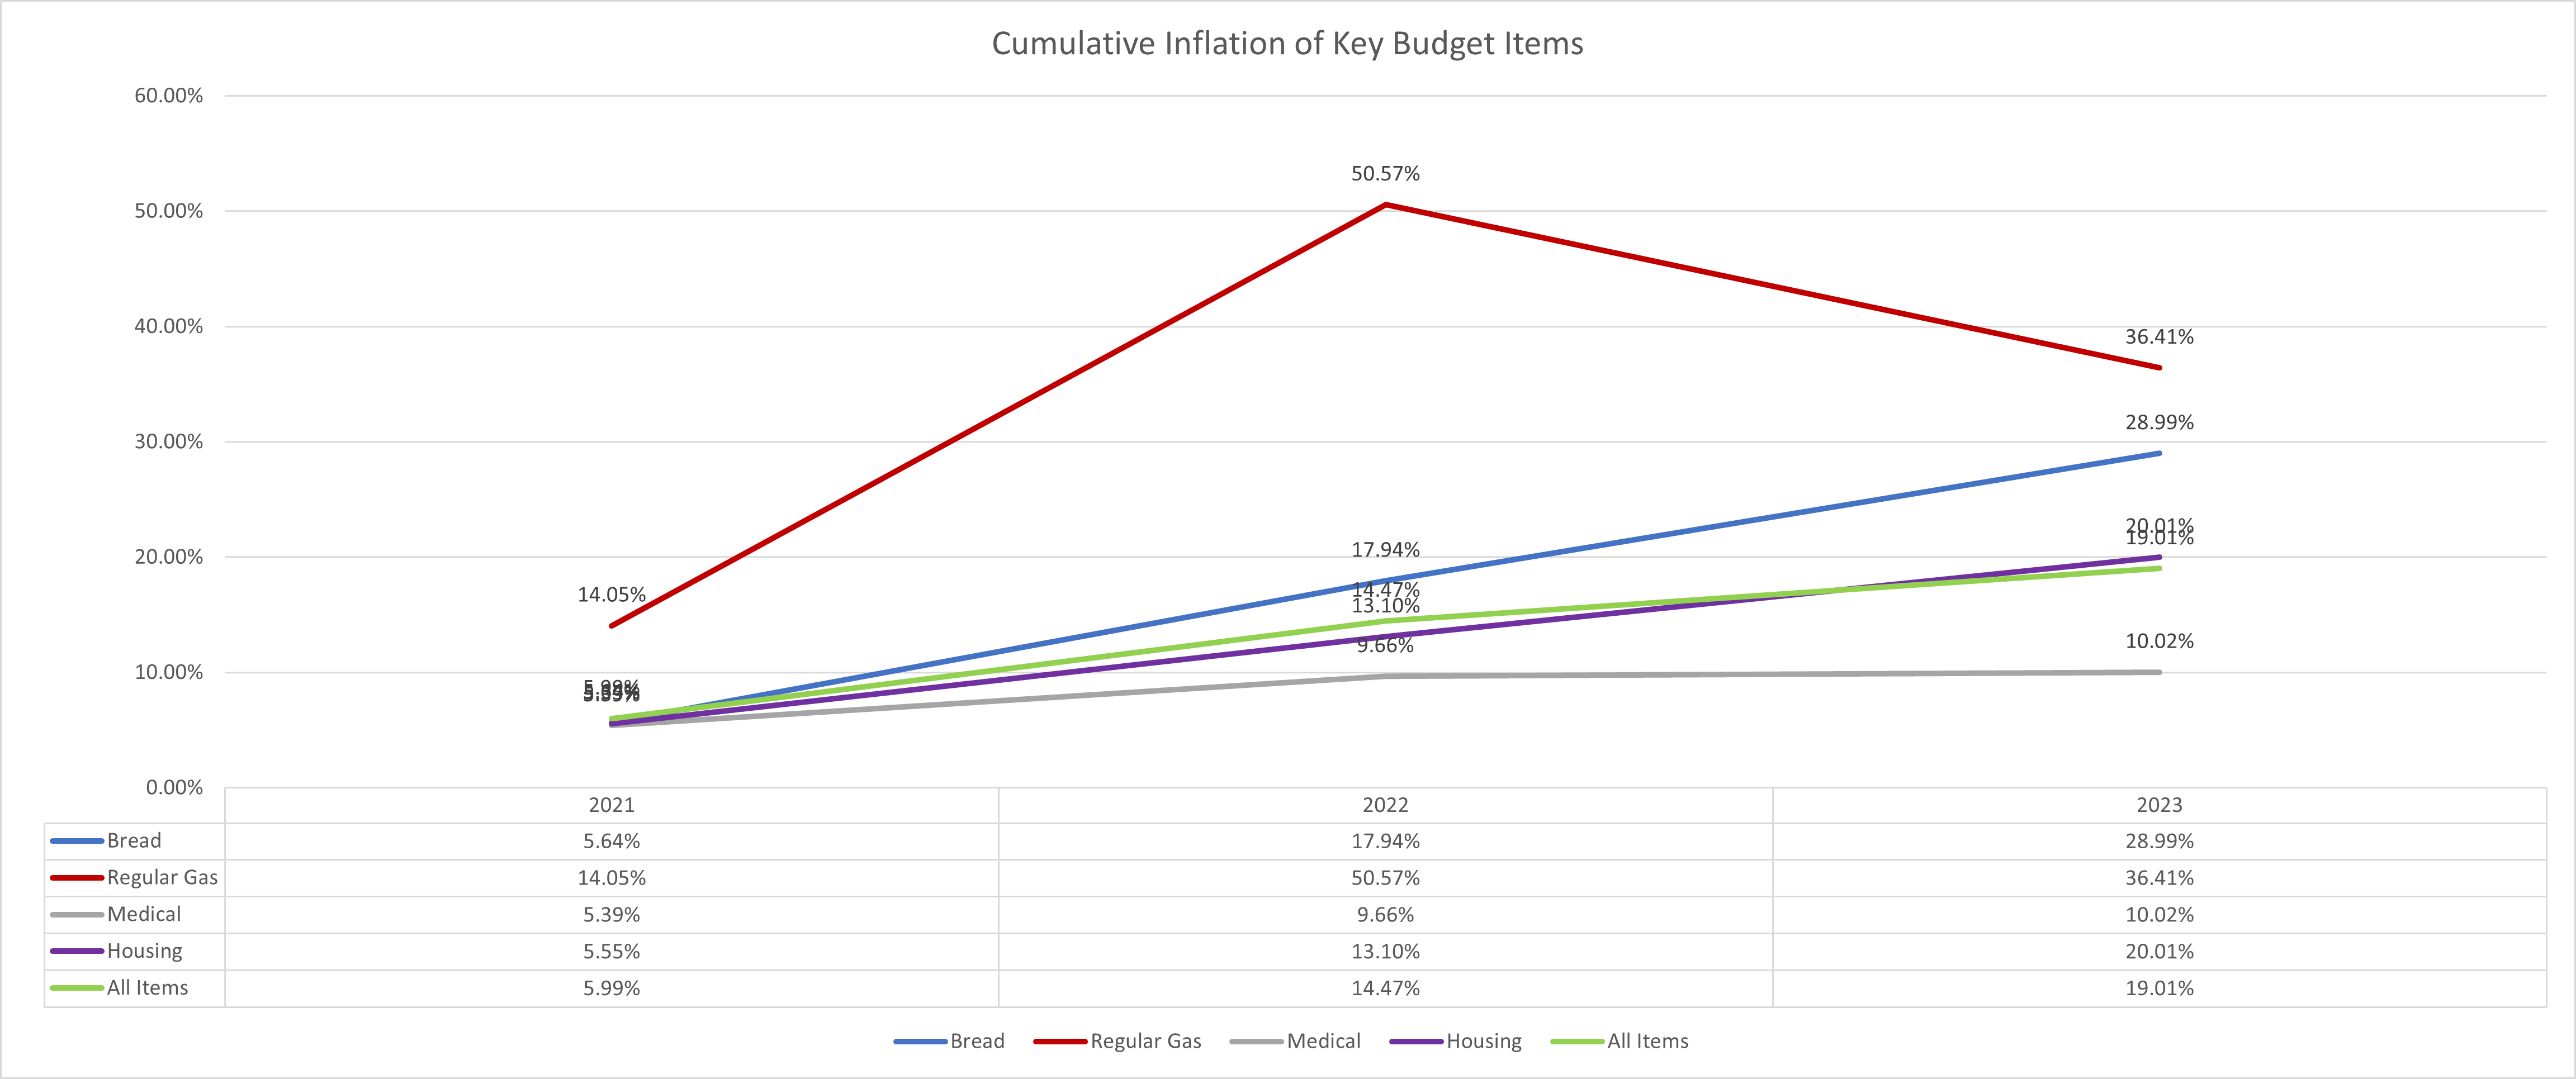
What we feel in our wallets is the accumulated effect of inflation. The effect is personal because state and local taxes can have an even more dramatic impact in many urban areas. But just from 2020, we feel the cumulative pressure from a 19.01% increase in overall prices. This has been a tough time for retirees because interest rates were held artificially low on savings while prices moved ever higher.
Unfortunately, as a nation, we are addicted to spending, and the consumer has not slowed down. The Covid money, savings, and credit cards have financed all this. Credit card debt has now moved on to “Buy Now, Pay Later” forms of credit, signaling that consumers are nearing the end of their spending capacity. When this merry-go-round ends, it could be ugly.
Bread
Most of us eat bread in some form, so this is a good shopping cart item to compare. Bread has gone up steadily since 2020 and is now up 28.99%. For some specialty bread, it may be up even more.
Many factors have pushed up bread prices, and an excellent global history lesson exists here. The War in Ukraine, inflation related to ingredients, rising labor costs, and increased demand from population growth are all factors. Bread also has a short shelf life and is not something you can buy in mass through online shopping.
Regular Gas
Most of us drive something that uses regular gas, which is the most painful of the four items we selected. We stopped drilling for oil, canceled leases, and canceled pipelines, and this is the result. It should be surprising to no one that regular gas is up 36.41% compared to 2020. It peaked at 50.57% in 2022, but opening the strategic oil reserve helped ease the pain slightly. We feel a little better, not because prices have come down from 2020.
The relative change from 2022 to 2023 is fresh in our minds. Across the globe, we are starting to see consumer pushback on the Green Agenda, from EVs to alternative energy to the mass execution of farm animals. There is more of a wait-and-see attitude developing with consumers and a recognition of moving too fast in this area.
Medical Costs
Medical costs surprised us the most in our small basket of examined costs. Since 2020, they have risen only 10.02%. But this is a small consolation since they have increased dramatically over the years, and we are measuring from a high point. The degree of cost offset from all the money paid by the Federal Government during and after COVID is difficult to know. From 2000 to 2023, medical costs rose 118%, only eclipsed by the price change in gasoline.
Housing
The change in housing is a cost that is difficult to measure because of the dynamics of urban versus rural prices, long-term affordability, and shortages. The price change seems primarily driven by shortages due to population growth and immigration.
For many, this will be their most significant purchase and asset. A 20.01% price increase is substantial but does not accurately reflect the tightest markets where competition and shortages prevail. With component price increases, housing looks to be at even higher prices unless consumer debt and rising interest rates bring the whole economy to a halt. The most significant average increases came from 2020 through 2023 and are accelerating.
Looking Ahead
With inflation, we are where we are, and without new leadership at the FED and in all areas of Washington, little will change. Vote carefully next November and pay close attention to candidates’ economic and spending statements. Without some fresh people willing to attack serious financial issues regardless of the political fallout, we may be headed to a Venezuela position on the world stage. We are giving the BRICS consortium precisely what they want to unseat the dollar as the world’s reserve currency. It is time to stop discussing the economy and spending and do something.
Resources Used in This Article
CPI Inflation Calculator, by Ian Webster, In2013dollars.com, last accessed December 1, 2023.
United States one hundred-thousand-dollar bill, Wikipedia.org, last accessed November 30, 2023.